I’ve been working on a video editor built on top of Electron and Rust, where Rust does the heavy lifting, and Electron (paired with Svelte) takes care of the UI.
Debugging the JS is easy enough: pop open Electron’s devtools, set some breakpoints, and you’re off to the races.
Debugging the Rust is a little harder. But it’s possible!
Here’s my setup for attaching VSCode’s debugger to the native Rust code, which is running within Electron’s renderer process.
Set up launch.json
VSCode’s debugger relies on a config file called launch.json. I think it can reside in a few different places; mine is in the .vscode directory in the root of my project, and it looks like this:
{
  // Use IntelliSense to learn about possible attributes.
  // Hover to view descriptions of existing attributes.
  // For more information, visit:
  // https://go.microsoft.com/fwlink/?linkid=830387
  "version": "0.2.0",
  "configurations": [
    {
      "type": "lldb",
      "request": "launch",
      "name": "Debug",
      "program": "${workspaceFolder}/backend/target/debug/recut",
      "args": [],
      "cwd": "${workspaceFolder}"
    },
    {
      "type": "lldb",
      "request": "attach",
      "pid": "${command:pickProcess}",
      "name": "Debug Electron Renderer",
    }
  ]
}
I have 2 configurations here:
- the first is for launching the Rust executable on its own, so I can debug the Rust in isolation.
- the second is for attaching to a running process
It’s the second one that we’ll focus on. That’s the one that matters for attaching to the running Electron process.
    {
      "type": "lldb",
      "request": "attach",
      "pid": "${command:pickProcess}",
      "name": "Debug Electron Renderer",
    }
I’m using a Mac, so type is lldb. This might need to be different for Windows.
The request is attach, meaning that VSCode will try to attach to an already-running process, instead of launching the app itself.
The pid is the special ${command:pickProcess} which will pop up a picker window within VSCode that’ll let you choose the process to attach to (more on that in a second).
The name is whatever descriptive name you want to use.
pid vs processId vs processName
There are a few different properties VSCode supports to let you choose which process to attach to.
I found this config from a StackOverflow question about attaching VSCode to a .NET Core app, and in the question, they used processId and processName instead of pid.
I’m not sure if this difference is a Mac vs. Windows thing, or if VSCode changed the names of these properties, but in my setup, processId did not work.
VSCode originally complained that it needed a “pid” so I used switched from processId to pid to get it working.
If you’re on Windows, you might need to swap out pid for something else.
Connect the Debugger to Electron’s Renderer Process
Before you can connect the debugger, the app needs to be running, so start it up however you normally do (npm run dev or whatever).
One important detail: make sure the native Rust module has been built with debug symbols included! Cargo’s --release flag will strip those out by default and you probably won’t be able to set breakpoints, so use cargo build instead of cargo build --release. You might need to modify your build scripts to make this change, if they inherently build in release mode.
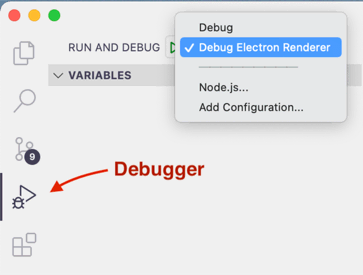
In VSCode, select the Debugger from the sidebar and choose the configuration from the dropdown at the top, then click the |> Play button to launch it.
Finding the Right Process
VSCode will prompt you to select a process to attach to, and you can type to filter the list.
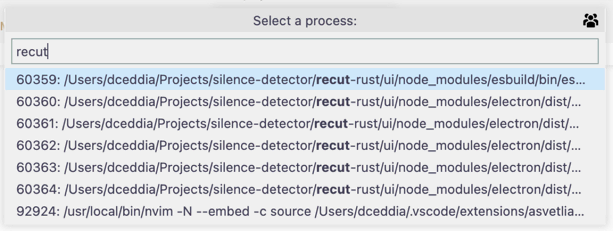
You can try typing “electron”, or the name of your project directory or executable to narrow it down.
This might not be terribly helpful, though. At least for me, VSCode’s dialog isn’t wide enough to show the full path, I couldn’t find a way to resize it, and hovering the rows doesn’t show the full text either.
And anyway, even if I could see the full path, they’re probably all the same.
Not a huge help.
Use Activity Monitor / Task Manager
To get a better view of the tasks, open up your OS’s task viewer. On Mac that’s Activity Monitor, under /Applications/Utilities. On Windows that’s the Task Manager.
Filter the list to just your app (“Electron” if you haven’t set the name yet, like I haven’t)
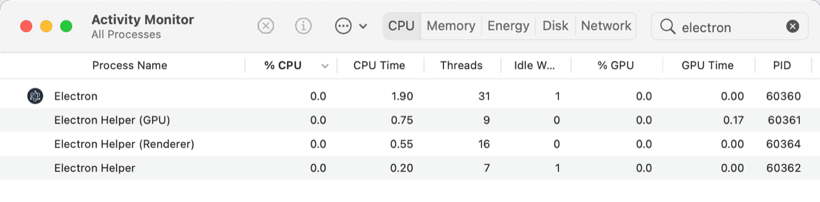
Look at the PID column for the one you want to attach to, and type that number into VSCode’s PID-picker popup.
As for which one to pick: connect to the Electron process which is running your native code.
- If that’s the Main process, look for the process named just “Electron” or “YourApp”
- If that’s the Renderer process, look for “Electron Helper (Renderer)” or “YourApp Helper (Renderer)”
If your code is in the Renderer process, and you have multiple windows open (e.g. Devtools), you’ll see multiple Renderer processes, which makes this harder.
I suggest closing the DevTools window if you have it popped out, and any other windows that are not the one you want to debug.
Set Breakpoints in VSCode
Once you’re connected, you should be able to set breakpoints within VSCode, inspect variables, and step in/out/continue/etc as usual.